Sample scorecard & catalog results
This page shows what catalog performance intelligence looks like in practice: a decision-ready scorecard, plus the portfolio instrumentation behind it: royalties vs ad spend, true cost per new reader, and audience and creative efficiency.
Illustrative / anonymized. Figures below come from multi-title fiction operations tooling (KdpDeck). They are not a promise of identical results on your list. Named press and agency case studies will replace pattern examples as paid Diagnostics complete.
What this page shows you
This is the sample. Everything below is the same evidence I build a Diagnostic from: what a new reader costs, what a new reader is worth, and the gap between them. If the format matches how your team makes decisions, the Diagnostic runs it on your own numbers.
The decision layer (what buyers keep)
Software can chart sales. Operators need a monthly answer to:
- Which series is healthy enough to fund?
- Which titles are ad sinks because the product/series handoff is broken?
- Which backlist earns a promo slot vs quiet harvest?
- What is the true cost to put a new reader into the funnel?
- What are the only five moves for the next 30 to 90 days?
That is the scorecard. Everything below is evidence that the analysis is grounded in real portfolio mechanics, not motivational advice.
1. Portfolio P&L: royalties beside ad spend
Amazon KDP reports royalties and units. Ad platforms report spend and clicks. Most teams never see net contribution on one timeline.
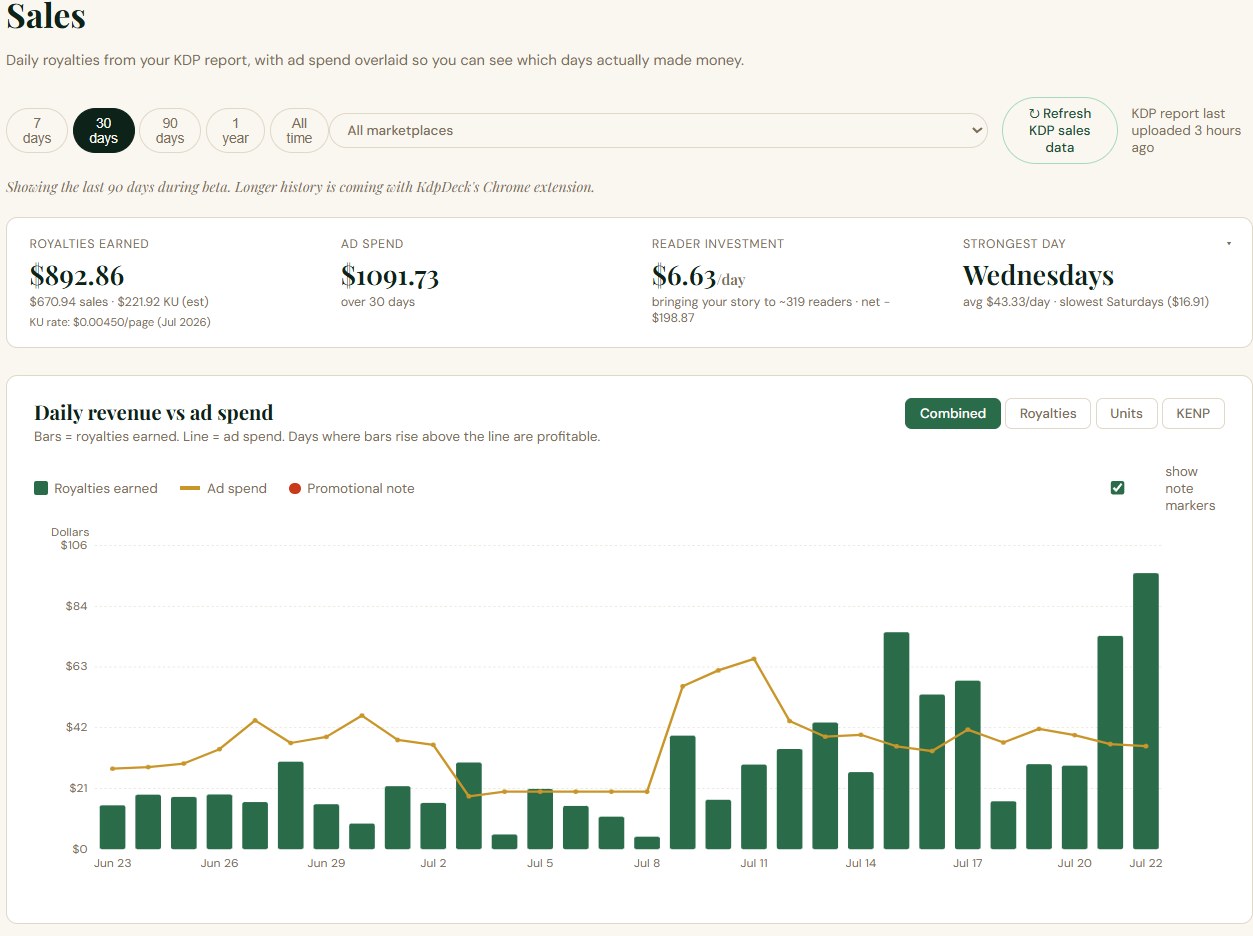
What to notice in a view like this
- Royalties earned vs ad spend vs net: the only scoreboard that matters for paid acquisition weeks
- Daily overlay: whether spend spikes actually move royalty days
- Strongest-day patterns: a scheduling signal for promos and boost windows
- Units, KENP, royalties, spend, net by day: an audit trail for the workshop
B2B use: imprint marketing meetings stop arguing from screenshots of two different products.
2. True cost per new reader (catalog acquisition)
CTR is not a business model. Reader acquisition cost is.
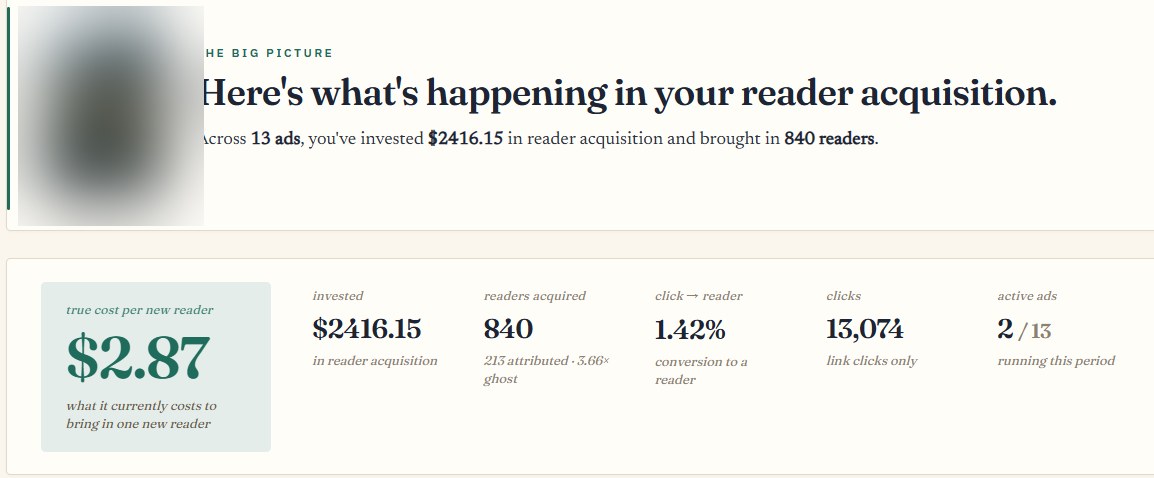
What to notice
- True cost per new reader as the primary KPI: live SFF accounts I have worked often land roughly in a $2 to $10 band when setup is sound; see the cost guide
- Invested → readers acquired → click-to-reader conversion
- Per-title / per-ad efficiency cards: which creative lines buy readers, which only buy clicks
- Change detection: new ads appearing in the portfolio without a manual treasure hunt
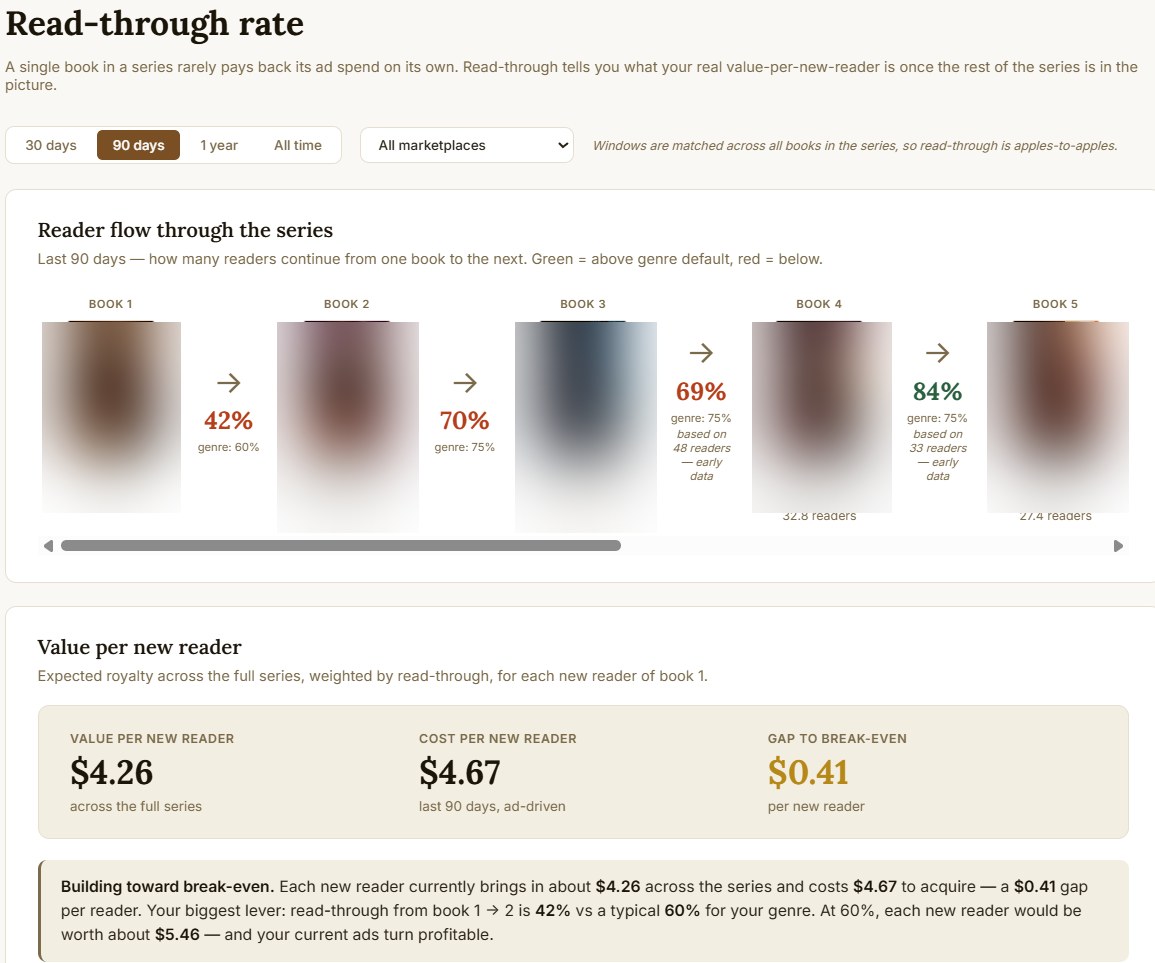
B2B use: compare acquisition cost to series LTV implied by read-through before scaling budgets. If Book 1 → Book 2 is broken, cheaper clicks still light money on fire (read-through benchmarks discussion).
3. Who converts: audience truth vs targeting folklore
Broad "fantasy readers" targeting is how catalogs waste Q4 budget.
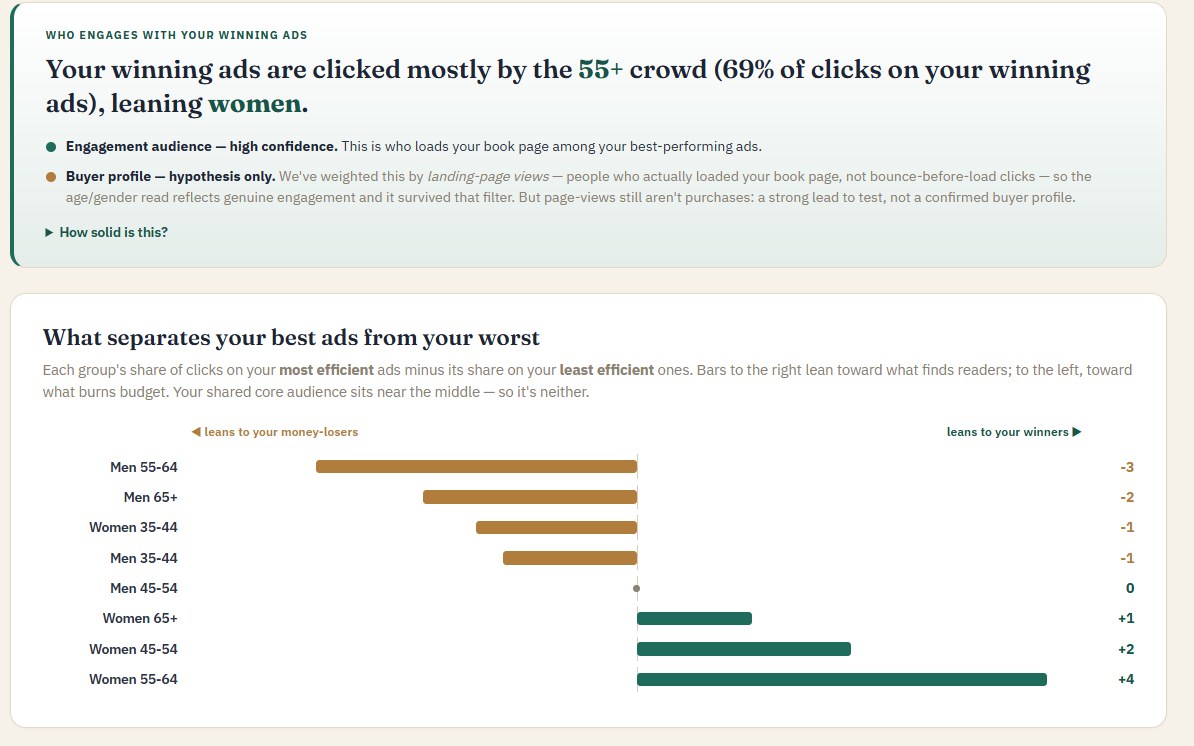
What to notice
- Demographic mix of clicks on winning ads vs losing ads
- Lean scores (example pattern: older female readers dominating efficient lines in a given list slice)
- Side-by-side efficient vs inefficient demographic breakdowns
B2B use: rewrite audience assumptions for the imprint; brief freelancers and agencies with evidence; stop funding creatives that attract non-buyers.
4. Creative attributes that buy readers
Covers and ad images are product decisions, not decoration.
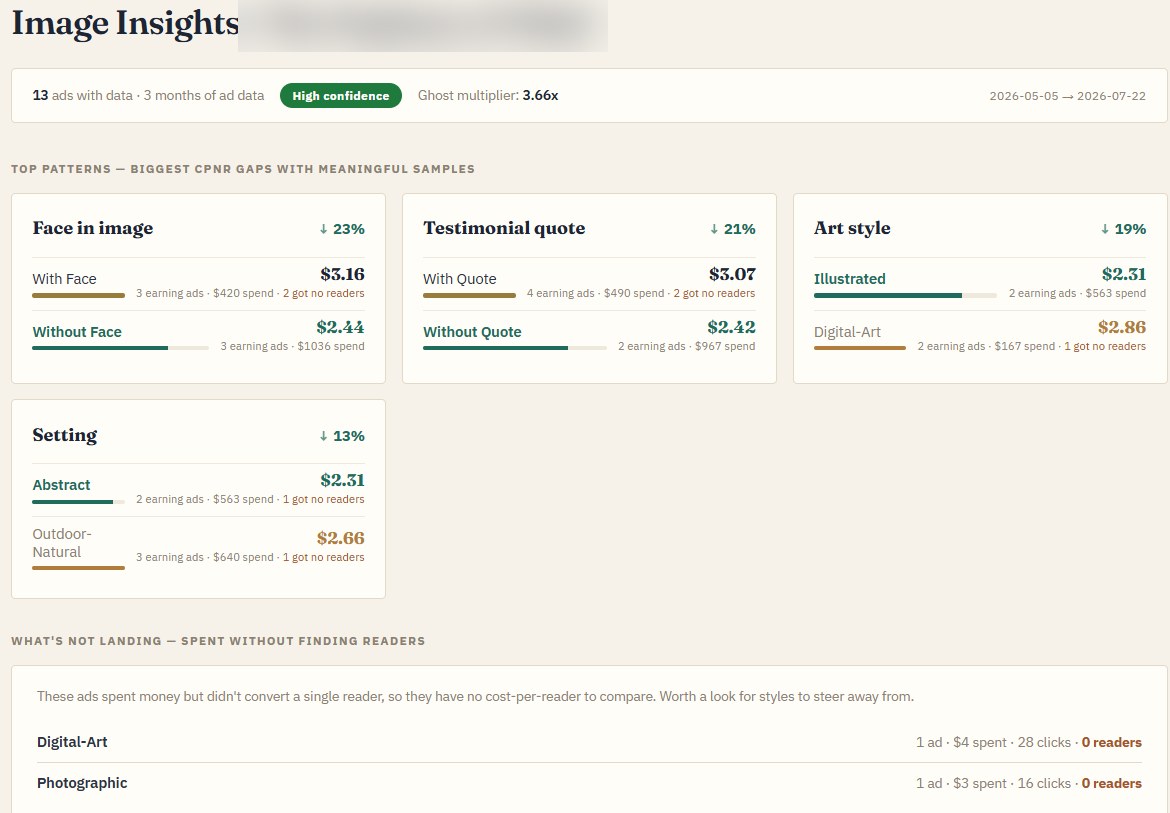
What to notice
- Cost per new reader by attribute (e.g. face in image, testimonial treatment, art style, setting)
- Gallery ranked by efficiency, with spend and readers acquired
- Converting vs not-yet-converting creative sets
B2B use: commission art and ad variations from data; kill pretty losers early; align cover direction with what the converting audience actually responds to.
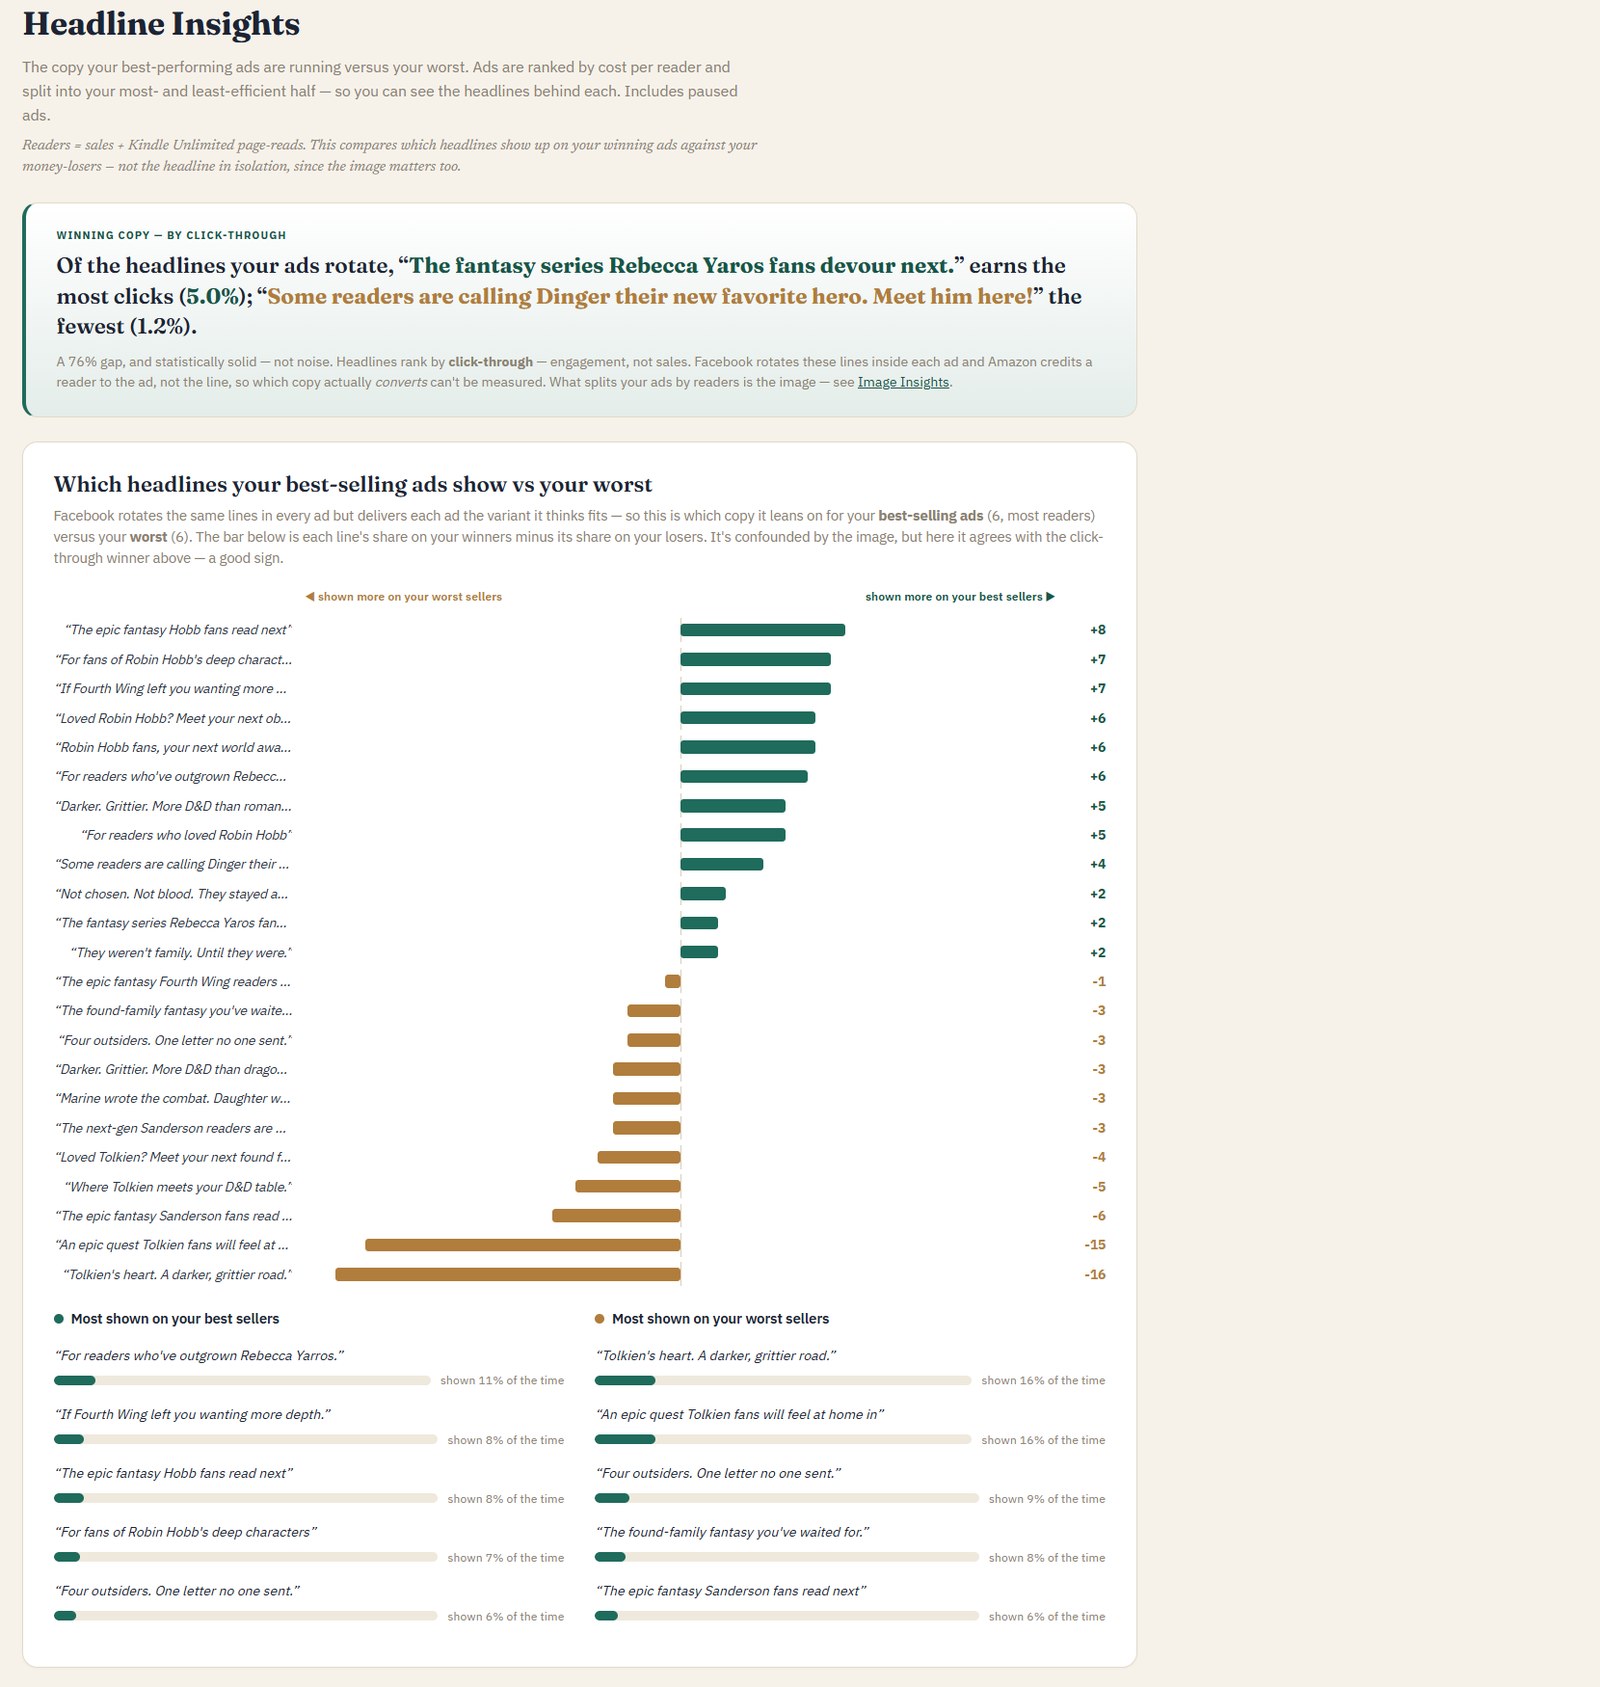
5. Headline systems at catalog scale
Hooks are a portfolio asset when you run many titles.
What to notice
- Winning vs losing headline CTR (illustrative gap: several points of CTR between best and worst lines)
- Distribution of headlines across best-selling vs worst-selling ads
- Volume behind each line (clicks and impressions) so you do not overfit a fluke
B2B use: standardize comparable-based hooks that work in your genres; build a swipe file per imprint; stop rotating untested cleverness across the whole list.
How this ties to series read-through
Instrumentation without series economics still misleads. A title can show acceptable ROAS in-platform while the series handoff is below a healthy band, especially when Book 1 is discounted or free.
In the full Diagnostic we calculate sell-through / read-through on your exports (paid and Kindle Unlimited where possible) and label the implication:
| Pattern | Typical implication |
|---|---|
| Strong B1→B2, high CPNR | Traffic / creative problem: test hooks and audiences |
| Weak B1→B2, any CPNR | Product / series problem: do not scale ads first |
| Strong frontlist, dead midlist | Promo and metadata triage opportunity |
| Spend without royalty response | Attribution and funnel break: fix before more budget |
Methodology references practitioners actually use: Kindlepreneur series read-through, Authors Game catalog read-through.
For agencies: white-label performance, not another content kit
If you already produce blurbs, comps, and social kits (including via platforms like ManuscriptReport's publisher services), keep them. Those are pre-launch / content assets.
What client calls still lack is a short post-launch performance narrative:
- Which client titles deserve ad dollars this month
- Which need a series / product fix instead
- Plain-language talking points your account lead can run in five minutes
Sample brief concepts follow the same evidence stack as above, with your logo on the cover. Pack pricing starts in the low hundreds per title or portfolio pack after you have seen format fit. Details on the Publishers ladder or by email.
Three tabs and a guess. Royalties here, ad spend there, a screenshot deck for the client call.
Five moves with owners. One page your account lead can run in five minutes.
Data handling (short version)
- CSV / export or screen-share only
- No KDP, Ads, or bank passwords (aligned with KDP security expectations)
- Mutual NDA available
- Full policy: Data handling
Next steps
- Scroll up and look at the evidence on this page
- If the format matches how your team decides, see what the Diagnostic includes
- Prefer a human overview first? Email [email protected] with your organization type and approximate title count
Get In Touch
Want the scorecard
on your catalog?
Tell me what you're working with, whether that's a press, an agency, or your own pen names, roughly how many books, and what you're using now. I'll send scope and price in writing, not a pitch deck.
Typical reply within one business day.
Or email directly
[email protected]